Charts Inside Your Editor — Turn Data Into Visuals Without Leaving the Document
Eddyter's Charts feature lets you build and embed data visualizations directly inside your editor. Pick a chart type, input or paste your data, customize the labels, and the chart renders inline in your document. No spreadsheet export, no screenshot cycle, no third-party charting tool.
Data tells stories. Charts make those stories scannable. Eddyter brings the whole flow into one place — write the context, build the chart, ship the document.
Insert Charts Without Leaving Your Editor
Most teams build charts the worst possible way: export data to Excel or Google Sheets, build the chart, export as image, drop into the document, realize the data changed, repeat. The workflow is so painful that most teams skip charts entirely and try to explain data with paragraphs.
Eddyter collapses the whole flow:
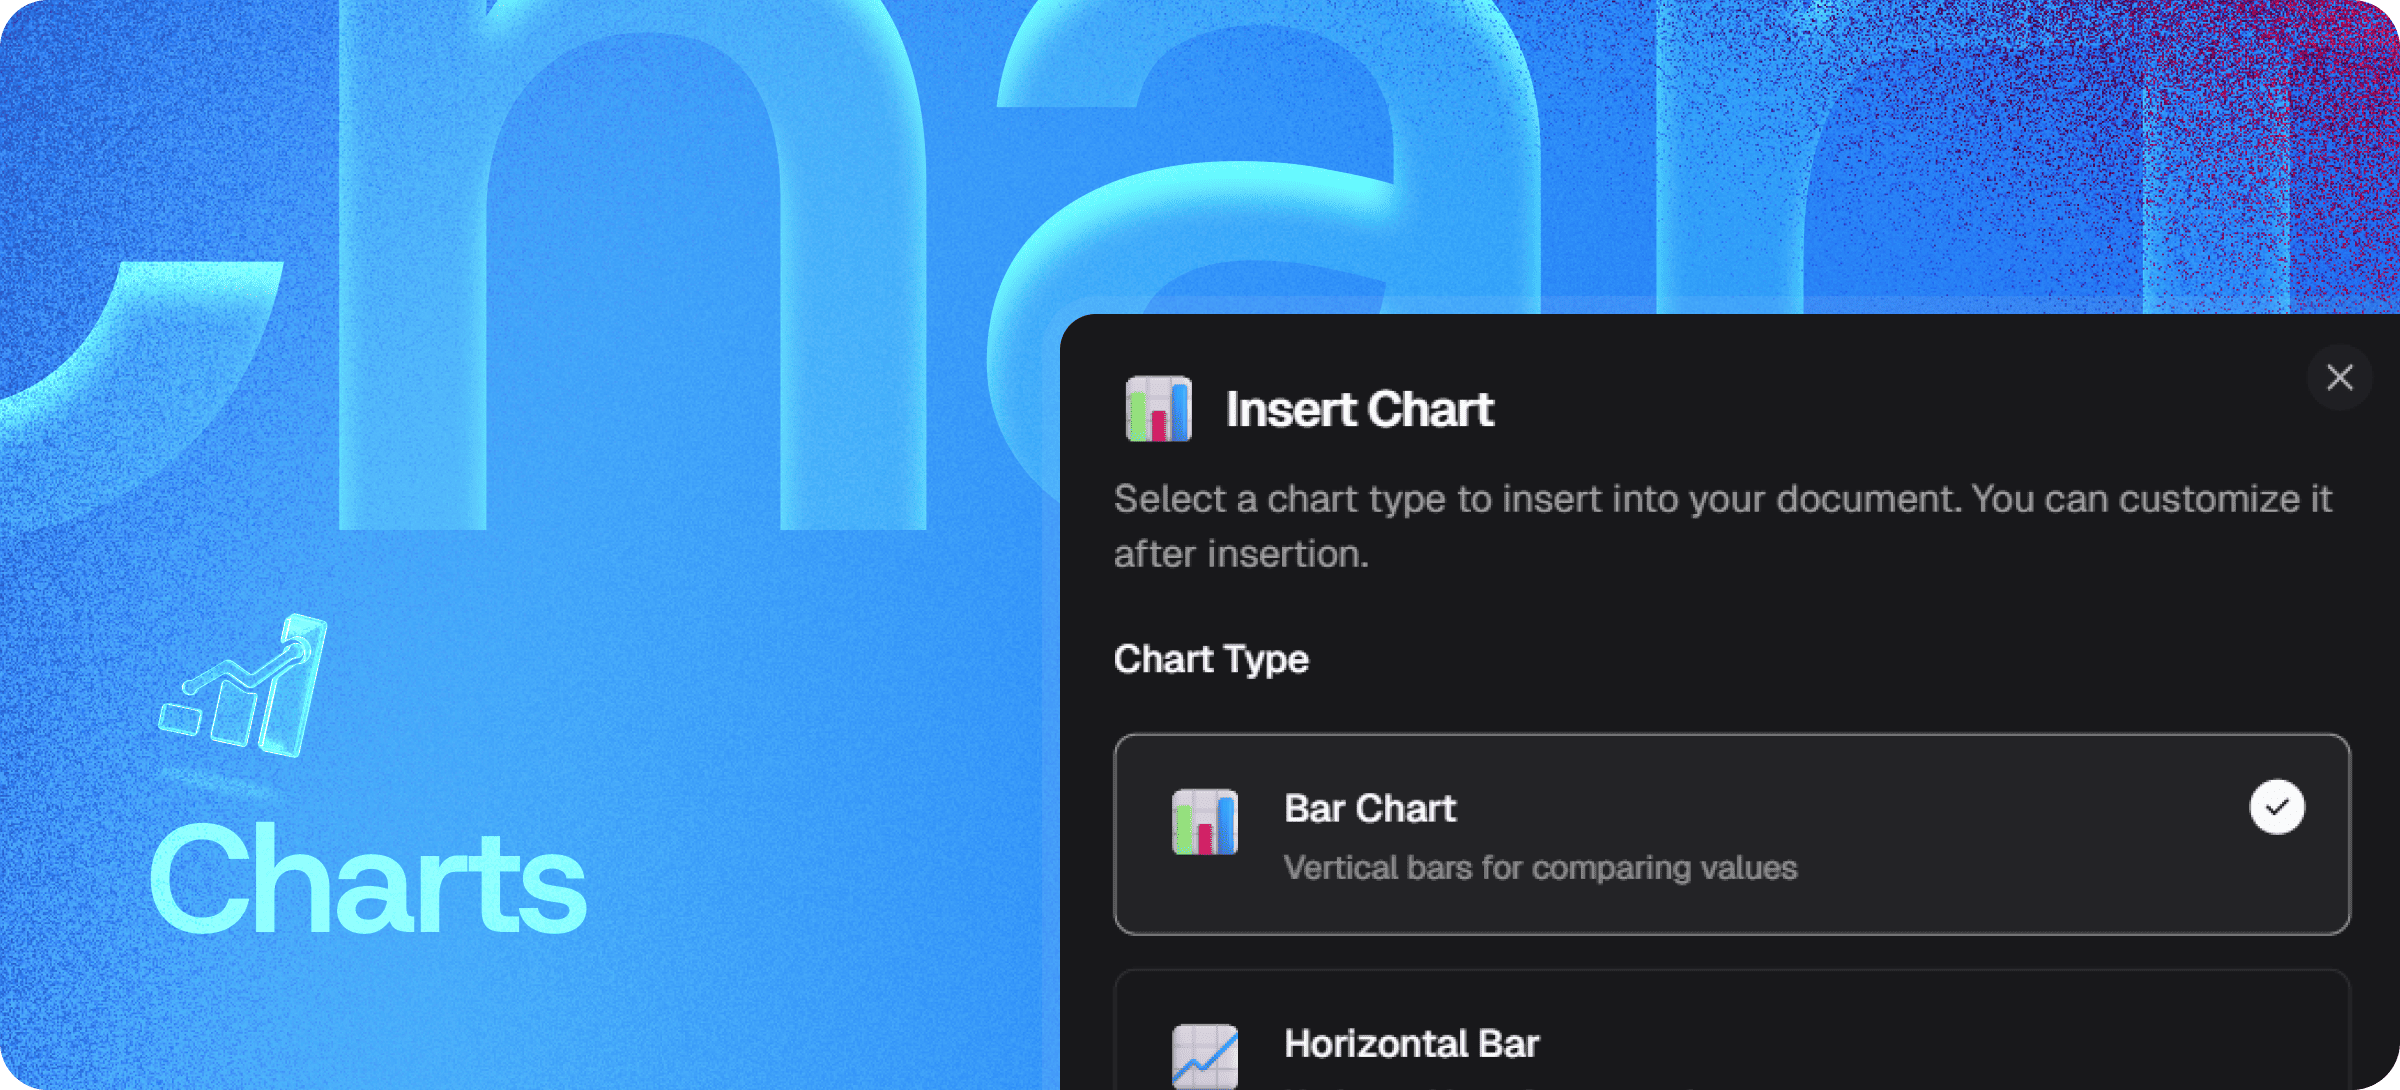
- Click Insert Chart inside the editor
- Choose a chart type from the supported list
- Input or paste your data directly
- Customize labels, colors, and layout
- Publish — the chart renders inline, editable later if data changes
Everything happens in-place. The chart is a content block like any other — drag it, reorder it, edit it, no spreadsheet trip required.
Supported Chart Types
⚠️ Placeholder — please verify with engineering and update before publishing. Currently confirmed:
- Bar Chart — Compare categories and values vertically
- Horizontal Bar Chart — Ideal for long labels and ranked comparisons
Other potential types to confirm: Line Chart, Pie Chart, Area Chart, Donut Chart, Scatter Plot, Combo Chart. Update this section with the actual supported list.
Each chart type can be customized after insertion — labels, axis ranges, colors, sizing, legend placement.
Fully Integrated Into Your Document Workflow
Because charts live inside your editor — not in a separate tool — your document becomes a single source of truth:
- No switching to spreadsheets mid-write
- No exporting images that go stale when data changes
- No broken links to externally-hosted charts
- No version mismatches between document and source data
- No screenshot quality loss at different resolutions
Your visuals stay editable, aligned with your content, and updatable in seconds.
Built Directly Into the Editor
Charts aren't a plugin or third-party library. They ship with the standard Eddyter editor on every plan, including Free.
For developers integrating Eddyter into a SaaS app, that means:
- No charting library (Chart.js, Recharts, etc.) to integrate separately
- No data-binding logic to write
- No responsive-chart handling to debug
- Works out of the box in React and Next.js apps
Setup details are in the Eddyter Documentation. New to the editor? What is Eddyter? is a 2-minute walkthrough.
How It Compares to External Chart Workflows
| | Excel/Sheets → image | External chart builder | Hand-coded charts | Eddyter Charts |
|---|
Inside the editor | ❌ Manual paste | ❌ Separate tool | ⚠️ HTML-only | ✅ Yes |
Editable after insertion | ❌ Re-export | ⚠️ Round-trip | ❌ Code edit | ✅ Yes |
Stays in sync with data | ❌ No | ⚠️ Variable | ❌ Manual | ✅ Yes |
Mobile-responsive output | ⚠️ Image-based | ⚠️ Variable | ❌ Manual | ✅ Yes |
Subscription cost | Free | Often paid | Free | Free on Eddyter |
Workflow friction | High | Medium | High | Minimal |
How to Build a Chart
- Select Insert Chart from the editor toolbar
- Choose your chart type (Bar, Horizontal Bar, or others — see Supported Chart Types)
- Input or edit your data in the chart editor
- Customize labels and layout — axis titles, colors, legend placement
- Publish instantly — the chart renders inline
To update the chart later, click it and re-open the data editor. Your changes apply immediately.
Where Charts Earn Their Keep
Product Documentation
Show feature adoption metrics, performance benchmarks, or API usage patterns inside documentation. Far more convincing than "we have great performance."
Reports and Proposals
Present quarterly metrics, project progress, or comparative analysis with proper visualization — not just tables of numbers.
Investor and Board Updates
Build investor-ready documents with embedded charts instead of stitching together PDF exports.
Internal Team Updates
Share weekly progress, KPI dashboards, or experiment results with embedded charts inline.
Blog Posts and Editorial Content
Data-driven blog posts that walk through a chart per section, with the chart embedded next to its narrative.
Knowledge Base Articles
Mini-dashboards in help articles showing things like outage statistics, response time benchmarks, or capacity metrics.
Why In-Editor Charts Matter in 2026
Visualizing data inside the document is no longer optional:
- Text-heavy content gets bounced by modern readers — visuals win attention
- Mobile readers can't scan dense tables of numbers
- Decision-makers want skimmable evidence, not paragraphs of explanation
- Documentation that ships at product velocity can't stop for external charting workflows
Eddyter's in-editor charts remove the friction. If you're evaluating Eddyter end-to-end, Integrate Eddyter in 30 Minutes walks through full setup including charts, tables, and other content blocks.
Charts at a Glance
Capability | Eddyter Charts |
|---|
Insert charts inside the editor | ✅ Yes |
Bar and Horizontal Bar charts | ✅ Confirmed |
Other chart types | See Supported Chart Types section |
Editable data after insertion | ✅ Yes |
Customizable labels and layout | ✅ Yes |
Mobile-responsive rendering | ✅ Yes |
Available on Free plan | ✅ Yes |
Works in React / Next.js apps | ✅ Yes |
External chart library required | ❌ No |
Frequently Asked Questions
Which chart types does Eddyter support?
TODO: Update this answer with the full list once confirmed. Currently confirmed: Bar Chart and Horizontal Bar Chart. Other chart types may be supported — verify with the Eddyter team or the Eddyter docs.
1. Can I edit chart data after inserting?
Yes. Click the chart, re-open the data editor, and make changes. Updates render immediately.
2. Are charts responsive on mobile?
Yes. Charts adapt to screen size and render cleanly across desktop, tablet, and mobile.
3. Can I customize chart colors and labels?
Yes. Each chart type supports label, color, axis, and legend customization after insertion.
4. Are Charts available on the Free plan?
Yes. Charts are included on every Eddyter plan, including Free.
5. Does it work in React or Next.js apps?
Yes. Eddyter is a drop-in React component, and Charts are part of the standard editor — no extra configuration required.
6. Can I import data from CSV or external sources?
TODO: Confirm CSV import capability with the Eddyter team.
Will charts render correctly in exported content?
Yes. Charts render as part of your content output and remain visually consistent across platforms.
Why It Matters
Data without visualization slows readers down. Tables of numbers force your audience to do mental math. Paragraphs explaining trends are tedious to read.
Charts make data immediate. Your reader sees the trend, the comparison, or the spike — instantly.
Eddyter's in-editor Charts make data visualization part of the writing workflow, not a separate detour through Excel.
Try Eddyter Free →